Hyperspectral 101
Hyperspectral Imagery: The Good, the Bad, and the Ugly
There’s been a fair amount of hype around hyperspectral imagery (HSI from now on) recently. In this blog post, I’ll cover a basic overview of what HSI is, what we can do with it, and where we can get it.
What is HSI?
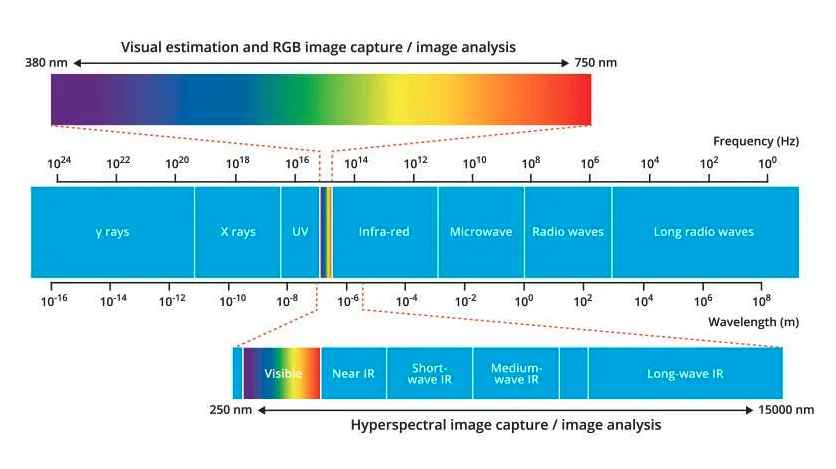
TLDR; HSI is just like an RGB image, but extended to hundreds of wavelength bands across the infrared to ultraviolet spectrum.
From eoPortal, an information source operated by the European Space Agency: “Hyperspectral imaging (HSI) is a process used to obtain high spectral resolution imagery by dividing light into many narrow, contiguous spectral bands across the electromagnetic (EM) spectrum, typically between visible and infrared wavelengths.”
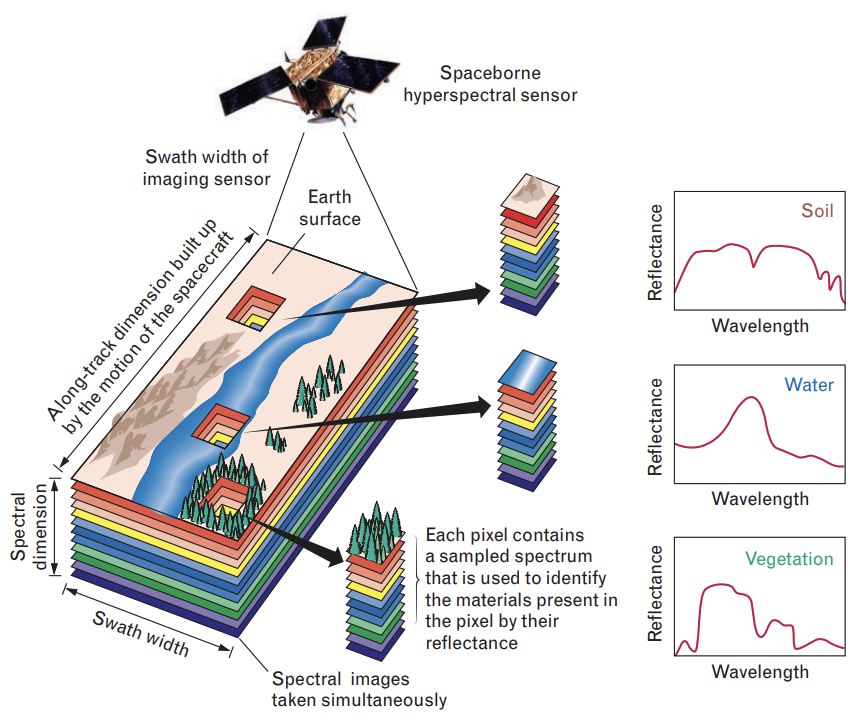
Despite its intimidating name and description, it’s actually a fairly simple concept. It takes the fundamental concepts of spectroscopy (familiar to any astronomer) and applies them to an entire image, so that every pixel contains a full, continuous spectrum of the light picked up from that point in an image.
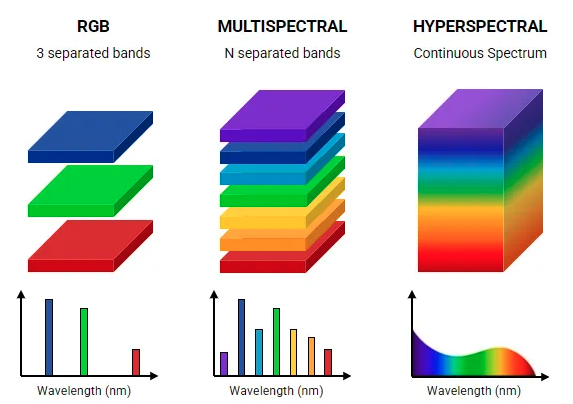
Where an RGB image records the intensity of light in three bands (red, green, blue — centered at approximately 660 nm, 520 nm, and 450 nm, respectively), HSI records the intensity of light in hundreds of narrow bands, estimating a continuous spectrum from near-infrared to ultraviolet.


Another form of spectral imagery is multispectral (visualized in the image above), which is a middle ground between traditional RGB imagery and HSI. Multispectral has fewer wavelength bands — typically around 3–20 — and the bands tend to be broader and more spread out. This results in a discrete and isolated collection of bands, as opposed to HSI’s “continuous” spectra. Therefore, while a significant step up from standard RGB, multispectral imagery lacks much of the information that HSI captures.
HSI is a process and is not an instrument in itself. Hyperspectral sensors implement this technique by collecting spectral information as a set of images. Hyperspectral sensors are commonly found in laboratory or handheld instruments like hyperspectral imaging cameras (commonly known as imaging spectroscopy), or in cameras stationed on satellites or airborne vehicles like planes or drones. While the applications of all types of HSI sensors are interesting, we will be focusing on the satellite instruments, or remote sensing hyperspectral imagery (RS HSI).
What can we do with RS HSI?
RS HSI data gives us an incredibly detailed view into the spectral nature of the reflected (or emitted) light it captures. It can detect the molecular or material fingerprint of surfaces, turning reflected light into quantitative, chemical, or structural insights. Another key component of remote sensing HSI that makes it unique is its periodic nature — as a satellite is in continuous orbit, it naturally revisits the same areas over and over again. This periodicity enables temporal analysis.
HSI has applications in a wide swath of fields including, but certainly not limited to, astronomy, environmental monitoring, defense surveillance, agriculture, geology and mining, forestry, urban studies, and disaster response.
In astronomy, the use of HSI is called integral field spectroscopy, or IFS.
IFS captures spectral variability across an entire image, so is especially useful in analyzing astrophysical phenomena like red/blueshifting in entire systems. Some examples of this application include galaxy kinematics, star formation rates, and outflows from AGN — pretty much anything that’s big and moving fast. IFS also excels at identifying chemical signatures in spectra, so it’s also often used for detecting metallicity gradients, ionization state diagnostics, and star formation rates. Instruments like NIRSpec IFU on JWST, WFC3/IR Grism (partial IFU) on HST, and MUSE at VLT all rely on IFS.
RS HSI has applications in defense and security (material-specific surveillance and explosive detection), geology and mining (mineral exploration), and urban planning (land cover/use classification). The applications of more direct interest in this blog post are centered around environmental and Earth science. RS HSI has been used to track vegetation health and species mapping, water quality monitoring (algae blooms, pollution), and natural hazard response. In lieu of the widespread fires in LA, wildfire detection has been of heightened recent interest.
In relation to my hyperspectral biodiversity project, phenological types, genera, and in some cases individual species can be identified from their spectra alone. In an upcoming blog post, I will summarize the complexities and challenges inherent to this idea called spectral species. For now, the reader should be content with the knowledge of the breadth of fields in which RS HSI has applications.

Where can we get RS HSI data?
Due to an influx of money pouring in from a subset of the earlier mentioned fields (the identification of which is an exercise left up to the reader), R&D in HSI has been fairly active over the past few decades. Nationally funded programs in countries like the US, India, Italy, Germany, and Japan have put up their own satellites with HSI instruments on them. And now, as more and more commercial satellite companies keep popping up and recognizing the profitability in this kind of data, there are more HSI instruments in orbit than ever before. Here’s a table summarizing the current state of HSI instruments.
| Launch Date | Name | Provider | Platform | Constellation Size | Wavelengths (nm) | Spectral Res. (nm) | Spatial Res. (m) |
|---|
All of these instruments have their own strengths and weaknesses. Factors to consider are spatial resolution, signal-to-noise ratio (SNR), swath width, revisit time, and imaged area.
Of all of these RS HSI instruments, only a handful of them have free, publicly available data.
Oftentimes, the greatest obstacle to acquiring RS HSI data is navigating the archaic websites, databases, and APIs where the data is housed. Most of these instruments require user accounts, and many require a proposed use of data.
Each instrument has its own data processing pipelines and requires different cleaning, normalizing, and rasterization techniques. Some instruments offer downstream data products, whereas other instruments have preexisting Python, R, and QGIS packages/plugins that scientists have developed for public use.
In my experience, EnMAP and PRISMA are the current gold standard for data quality and ease of access, with EnMAP edging out PRISMA due to its global span (PRISMA is a young project and only has limited data in Italy easily available). I’ll go into detail on EnMAP data access and manipulation in a future blog post.
Thus concludes Hyperspectral 101.
Enjoy Reading This Article?
Here are some more articles you might like to read next: